Many teams are tracking AI visibility but struggle to understand what the data actually means. An AI visibility dashboard surfaces mentions, citations, sentiment, share of voice, and positioning across platforms, but without a clear framework, these numbers can feel disconnected.
When analyzed properly, this data reveals where a brand is being selected, where it is missing, and why competitors are appearing instead. It helps uncover content gaps, authority issues, and positioning weaknesses, signals that go undetected until brand mentions in AI search are tracked systematically.
This guide walks through how to interpret an AI visibility dashboard step by step, so teams can move from uncertainty to clarity and make informed decisions that improve how their brand appears in AI-generated responses.
TL;DR
- An AI visibility dashboard shows how often your brand is selected, cited, and positioned in AI-generated responses.
- Analyze performance across multiple angles, metrics, prompts, platforms, competitors, and trends to find real gaps.
- Prompt-level and platform-level insights show where you win, where you lose, and where competitors dominate.
- Common patterns (high mentions but low citations, weak discovery visibility, poor positioning) highlight authority and content gaps.
- Turn insights into action by fixing content, improving structure and authority signals, and tracking changes regularly to grow visibility across AI platforms.
Key Metrics Inside an AI Visibility Dashboard
These metrics show how often your brand appears, how it is used, and how it is positioned in AI responses. Each metric captures a different dimension of visibility and helps you understand not just presence, but influence.
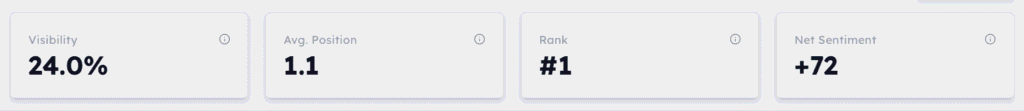
- Visibility Score is a composite indicator of your overall AI visibility. It reflects how consistently your brand appears across prompts and platforms, and is built from signals like mentions, citations, positioning, and sentiment. Dashboards usually show it as a single index value with a trend line so you can see movement over time.
- Citation Rate measures how often your content is used as a source in AI-generated answers, not just mentioned. The dashboard compares the number of responses that cite your content against the total responses analyzed and presents the result as a percentage, often broken down by platform or content source, so you can see where authority is strongest.
- Mention Rate captures how frequently your brand appears across tracked prompts and platforms. It is a volume metric based on the total count of brand mentions inside AI responses, usually paired with trend data and segmentation by prompt type or platform.
- Share of Voice shows your brand’s visibility relative to competitors. The dashboard compares your total mentions against the combined mentions of all competing brands within the same prompt set, then displays the result as a percentage alongside competitor benchmarks so you can see where you lead or lag.
- Sentiment reflects how your brand is framed in AI responses, positively, neutrally, or negatively. It is derived from the language and context surrounding each mention, and dashboards usually visualize it as a distribution split with trend indicators so you can track shifts over time.
- Positioning indicates where your brand appears within the AI response. It is based on the placement of mentions, such as top, middle, or bottom of the answer. Dashboards present this as ranking buckets or average position, highlighting whether your brand is leading the response or buried among other mentions.
How to Interpret Your AI Visibility Dashboard From Different Angles
Looking at a single metric in isolation leads to incomplete conclusions. An AI visibility dashboard needs to be read from several angles to understand what is actually happening. Each view explains performance in context. The combinations of metrics explain why that performance exists and what needs to change.
# By Metric: What Each Number Actually Tells You
A 70% visibility score with negative sentiment on the dashboard indicates the brand appears often, but is framed poorly. This is a positioning problem, not a reach issue.
A high mention rate (e.g., 60%) with a low citation rate (e.g., 15%) shows the brand is frequently referenced but rarely used as a source. This signals surface-level visibility without authority.
A share of voice at 20% when competitors hold 40-50% on high-intent prompts indicates clear displacement. Competitors are being selected where decisions happen, pointing to gaps in both content depth and authority signals.
These numbers matter because they show not just if your brand is visible, but whether it is trusted, preferred, and chosen in AI-driven decisions.
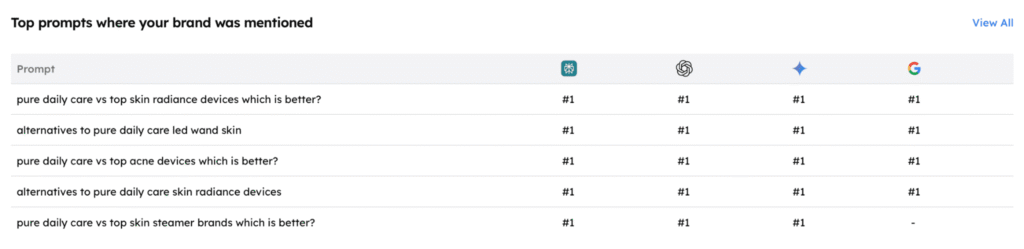
# By Prompt Type: Where You Win vs. Where You Miss
The dashboard groups prompts by intent and shows where your brand appears and where it is not. For example, 90% visibility on branded prompts but only 20% on discovery prompts shows strong demand capture but weak reach.
Branded prompts show how well you capture existing awareness. Category and discovery prompts show how well you reach new users. Weak discovery coverage means missed growth.
Check which prompt types competitors dominate. If they appear consistently on discovery or comparison prompts where you are absent, those are priority gaps.
Prompt type links visibility directly to user intent. It shows where you win, where you lose, and where to expand.
 Pro Tip: Refining AI visibility strategy is easier when there is a clear picture of which sources are cited in AI-generated answers. Run a quick audit with a free AI visibility checker and see how your content currently performs across AI search platforms.
# By AI Platform: Performance Across Different Engines
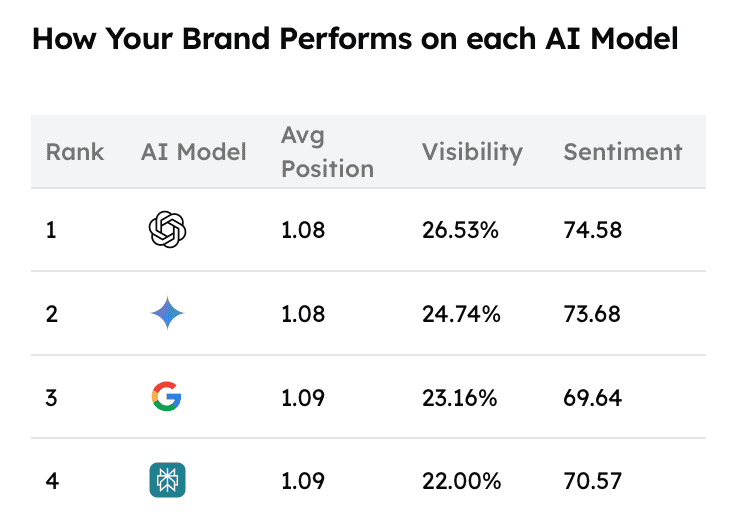
The dashboard breaks down visibility by platform and shows where your brand ranks within responses. You may rank in the top 1-2 positions on ChatGPT, but not appear at all on Google AI Overviews. This indicates uneven visibility across models.
Each platform ranks and cites sources differently. ChatGPT, Perplexity, Google Gemini, and Google AI Overviews prioritize different signals for selection and placement.
A brand that ranks high on one trusted platform and seo tools may be absent on another due to content format gaps or missing authority signals. What works for one model does not automatically transfer to others.
These competitive gaps are not random. They point to specific issues in content structure, coverage, or trust signals. Visibility across different platforms shows where your brand is winning, where it is missing entirely, and what needs to change to achieve consistent ranking across AI search.
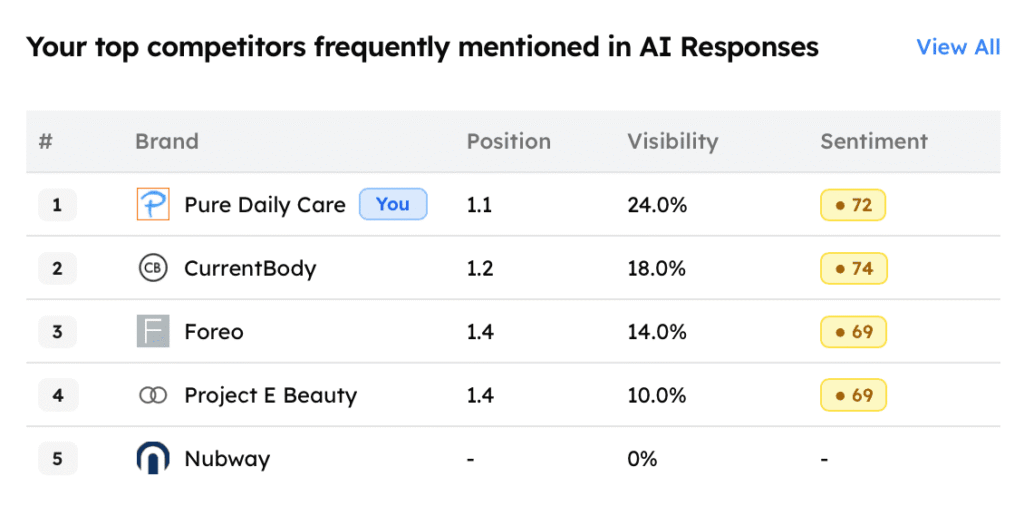
# By Competitor Comparison: Relative Visibility Gaps
The dashboard compares your visibility directly against competitors across the same prompt set. It shows where your brand appears, where competitors appear, and where you are missing. If a competitor appears on 70% of high-intent prompts and your brand appears on only 30%, the gap is clear.
Use this view to find prompts where competitors are present, and your brand is not. Those are direct displacement points. The dashboard also groups prompts into clusters, which makes it easier to spot competitor dominance across specific topics or intents.
Do not rely on single responses. Focus on share-of-voice trends across multiple prompts. Consistent gaps matter far more than one-off misses. Competitor analysis shows who is winning in the same decision space and exactly where your brand needs to compete for LLM visibility.
# By Funnel Stage: Awareness vs. Consideration vs. Decision
The dashboard maps prompts to funnel stages and shows where your brand appears across awareness, consideration, and decision queries. For example, 80% visibility on awareness prompts, 50% on consideration, but only 10–15% on decision prompts, highlights a critical drop at the bottom of the funnel.
Awareness prompts (category-level queries) show how well you reach new users. Consideration prompts (comparisons, alternatives) show how well you stay in the evaluation set. Decision prompts (best, recommended) show whether you have actually been chosen.
Gaps at the decision stage carry the highest conversion cost. If competitors dominate “best” or “recommended” prompts where your brand is absent, you lose high-intent users.
Strong awareness visibility with weak decision visibility means the brand is known but not recommended. This connects visibility directly to business impact, showing where presence fails to convert into selection.
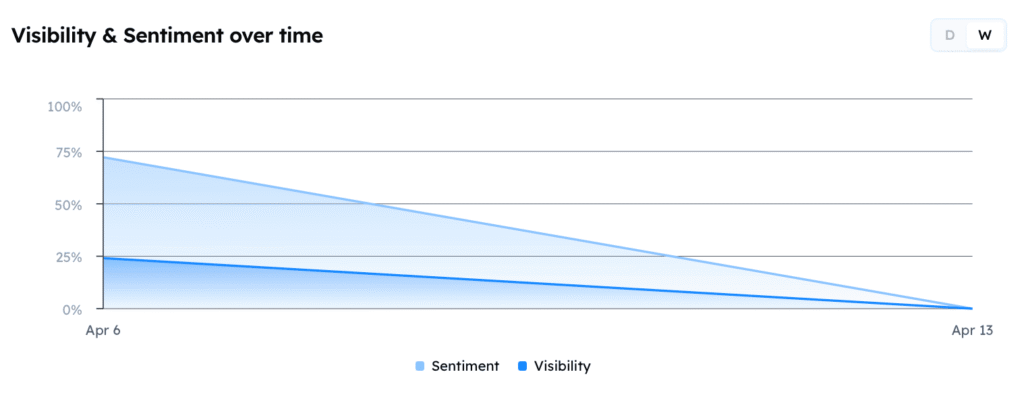
# By Trend Over Time: Improving or Declining
The dashboard tracks visibility metrics over time and shows whether performance is improving or dropping. It compares visibility score, mention rate, and citation rate week-over-week or month-over-month to highlight direction.
A drop in LLM citation rate after a content update shows the update did not improve authority signals. An increase in mentions and visibility score over time confirms that changes are working.
Trend data removes noise. One-time appearances can mislead, but consistent patterns show real performance. It separates temporary visibility from structural growth and shows whether your actions are actually improving AI visibility.
Alt:
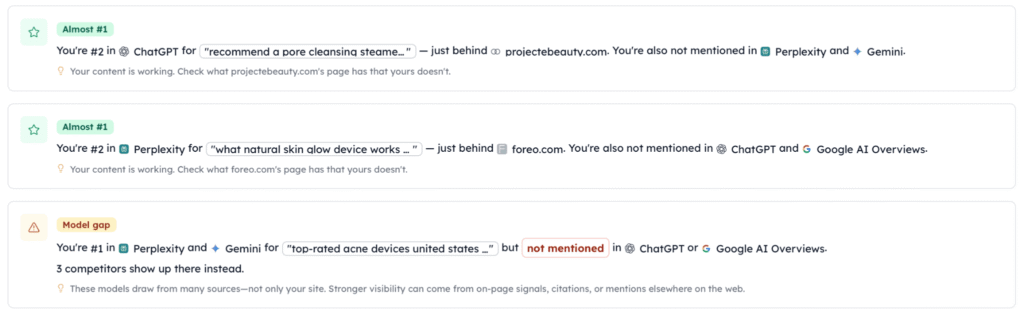
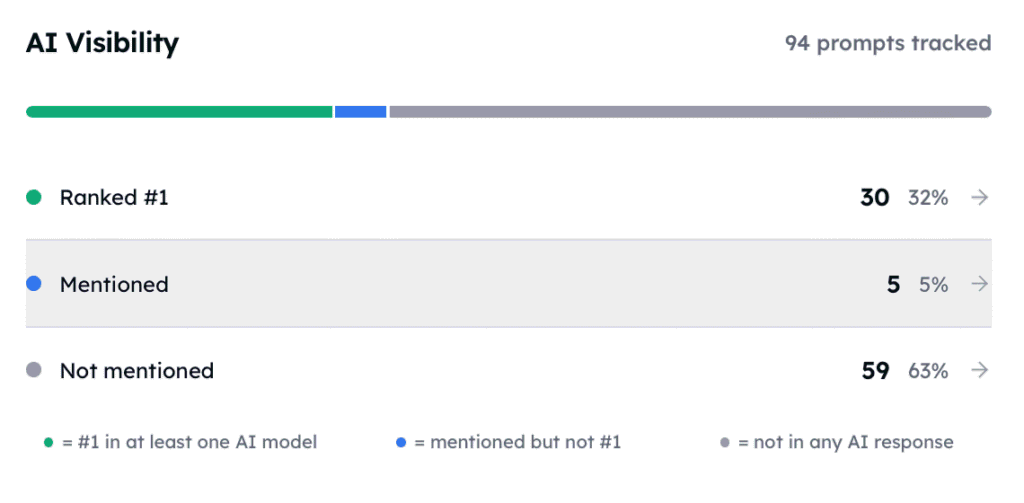
# By Positioning: Top Mentions vs. Buried Mentions
The dashboard shows where your brand appears within AI responses. When measuring AI visibility with prompt tracking, it breaks positioning into top, middle, and bottom placements. For example, a 40% mention rate but only 10% in the top 3 positions shows low effective visibility.
Top 1–3 mentions carry the strongest influence on user decisions. These positions are most likely to be noticed and selected. Mid or low placement reduces impact, even when the brand is present.
The dashboard separates presence from placement. This helps you see whether visibility is driving real influence or just passive inclusion. Positioning quality determines whether your visibility converts into decisions.
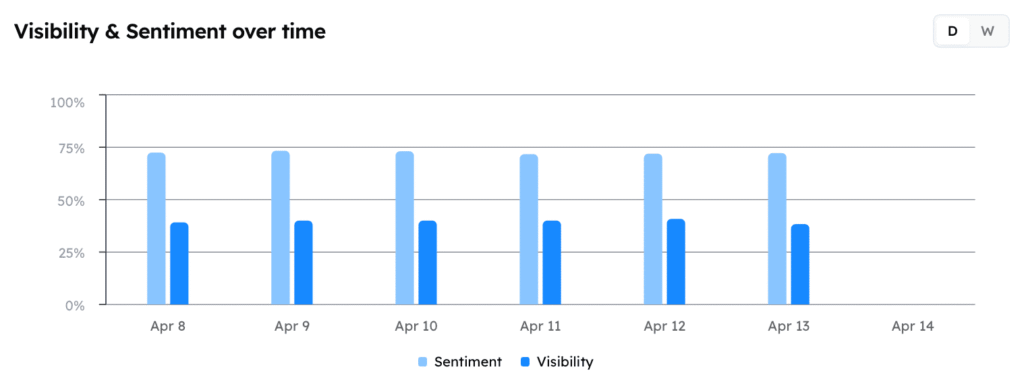
# By Sentiment: How the Brand Is Being Framed
The dashboard shows how your brand is described in AI responses. It classifies mentions as positive, neutral, or negative and tracks how this changes across prompts and platforms. For example, a high visibility score with 60% neutral sentiment shows presence without strong differentiation.
Positive sentiment drives recommendation and selection. Neutral sentiment signals weak positioning. Negative sentiment reduces trust and limits inclusion in high-intent responses.
The dashboard also clusters sentiment by prompt type. If negative or neutral sentiment appears consistently on specific prompts, it points to a clear content or trust signal gap in that area.
Trend data shows whether sentiment is improving over time. This helps validate if content updates and authority signals are working.
Alt:
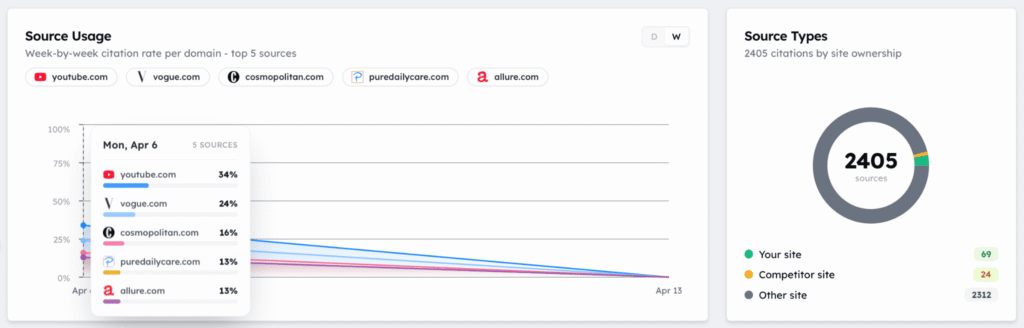
# By Sources: Which Sources Drive Citations
The dashboard shows which external sources are being cited alongside your brand in AI responses. It maps citations back to publications, reviews, directories, and other domains. For example, 70% of your citations come from review sites and none from high-authority publications, which points to a thin authority profile.
Use this view to identify which sources consistently drive your citations and optimize your content accordingly. Then compare with competitors. If competitors are cited from stronger or more diverse sources where you are absent, that is a clear authority gap.
The view also reveals source overlap and gaps across prompts and platforms, which helps you see which sources move visibility the most.
These insights matter because citations are tied to source credibility. Source-level data tells you where to invest, whether in digital PR, link building, or content placement, to improve authority and lift citation likelihood.
Common Patterns and Gaps to Look For
The dashboard reveals patterns that repeat across metrics, prompts, and platforms. These patterns highlight where visibility exists but underperforms, and where clear gaps limit growth. Focus on combinations of signals, not isolated numbers.
- High mentions, low citations show surface-level visibility. The brand appears often but is not trusted as a source, which points to weak authority signals.
- A high visibility score with negative or neutral sentiment indicates a positioning issue. The brand is present but not framed strongly enough to influence decisions.
- Strong branded visibility, weak discovery visibility, shows an awareness ceiling. The brand performs well on known queries but misses new demand.
- Low share of voice on high-intent prompts signals displacement. Competitors are being selected where decisions happen.
- Good presence but low positioning means the brand is buried in responses. Visibility exists, but impact is low.
- Platform-specific gaps show inconsistent performance. Strong visibility on one platform and absence on another usually points to content or authority mismatches.
- Competitor dominance on specific prompt clusters highlights targeted gaps. Repeated losses in the same topic area call for focused content expansion.
Turning Dashboard Insights Into Actions
Start with the overview to assess overall health. Then drill into platform gaps, competitor benchmarking, prompt coverage, and sentiment in that order. Use the dashboard as a diagnostic tool. Focus on what to fix, not just what to measure.
Set a clear review cadence. Analyze weekly during active optimization and bi-weekly for steady monitoring. Tie every content update to outcomes. Track changes in mention rate, citation rate, and positioning within 2 to 4 weeks.
Convert insights into reports using visibility score, share of voice, and prompt coverage. These metrics show business impact without requiring deep LLM knowledge. This approach improves visibility across AI platforms and gives teams clear, actionable direction.
Pro Tip: How much of today’s search activity is already being answered by AI platforms before a user ever clicks a link? Explore this latest AI Search Statistics data, which breaks down the numbers behind AI citation trends, platform growth, and how citation weighting has shifted across platforms.Quick Actionable Steps:
| Insight from Dashboard | Action to Take |
| Overview shows a low or unstable visibility score | Drill into platform gaps, prompt coverage, and sentiment to find the root cause |
| High mentions but low citations | Improve content structure, add clear answers, and strengthen authority signals |
| Strong visibility on one platform, weak on others | Adapt content format and build authority signals for missing platforms |
| Competitors dominate key prompts | Create or optimize content targeting those specific prompts |
| Low coverage on discovery prompts | Expand content for category and intent-driven queries |
| Weak positioning (buried mentions) | Improve content clarity, depth, and relevance to move into top positions |
| Negative or neutral sentiment | Fix content quality, add trust signals, improve framing |
| No visibility on high-intent prompts | Prioritize “best,” “recommended,” and comparison content |
| Visibility drops after content updates | Re-evaluate changes and adjust content strategy quickly |
| No clear trend over time | Establish weekly or bi-weekly tracking to identify patterns |
| Competitors cited from stronger sources | Invest in digital PR, backlinks, and high-authority placements |
| Data is hard to explain to stakeholders | Report using visibility score, share of voice, and prompt coverage |
Start Monitoring With the Right Tool
An AI visibility dashboard is only as useful as the framework used to interpret it. The real value comes from analyzing data systematically by metric, platform, prompt, and trend, so insights turn into clear actions.
Brands that follow this approach build a compounding visibility advantage. They identify gaps faster, improve positioning, and stay consistently present across AI-generated responses.
As AI search continues to influence discovery and decision-making, dashboard fluency will become a core skill for business teams who want to track AI search visibility and build brand authority.
Tools like Track My Visibility make this easier. They provide a clear, structured dashboard that simplifies analysis across platforms, prompts, and competitors, helping brands track visibility, understand gaps, and take faster, more informed actions.
Try our 7-day trial to see how it works and where you stand.
FAQs
An AI visibility dashboard tracks how often and how effectively your brand appears in AI-generated responses. It shows metrics like mentions, citations, share of voice, sentiment, and positioning across platforms.
Traditional SEO focuses on rankings and clicks. AI visibility focuses on whether your content is selected, cited, and positioned within AI-generated answers.
The most important metrics are visibility score, citation rate, mention rate, share of voice, sentiment, and positioning. Together, they show both presence and influence.
You should review it weekly during active optimization and bi-weekly for ongoing monitoring. Regular analysis helps track trends and measure the impact of changes. Tools like Track My Visibility help to track and analyze AI visibility data across major AI platforms with actionable insights.
Focus on creating clear, structured content, strengthening authority signals, covering high-intent prompts, and improving how your brand is positioned and cited across platforms.